Friday, April 5, 2013
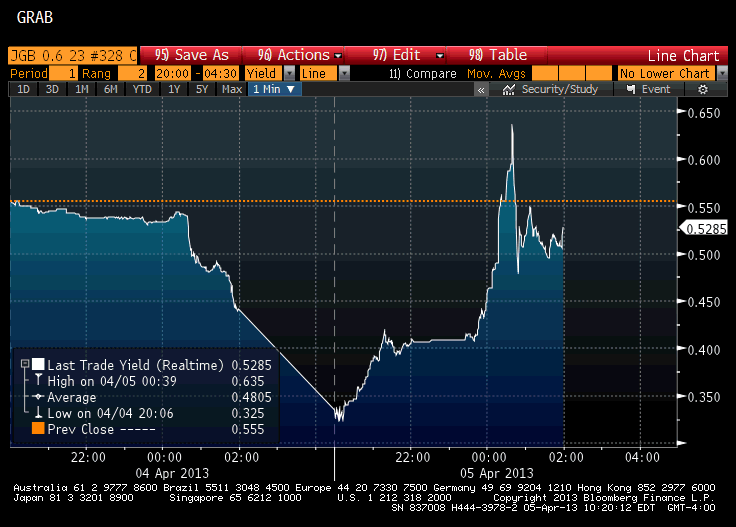
Wide gyrations yesterday and today in the JGB, Japan's 10-year rates. Rates volatility is supposedly lower when absolute levels are low, such as in the Cox Ingersoll Rand model...
 Some CTA and macro hedge funds had an excellent day yesterday if they were long Japanese rates. But today will test their profit taking and stop losses rules; probably many will give back yesterday's profits.


Monday, June 28, 2010
Correlation Between S&P500 and 10-yr Tsy: An Ominous Sign?
There is a new peak in the correlation between the S&P500 and the yield on the 10yr Treasury. The bottom graph in the screen shot below is that of rolling 120-day correlations. If we consider 60-day rolling, correlation would be even higher at 84%. It hasn't been as high since late 07 and all of 08. What are markets telling us?...


Factor Analysis of Hedge Funds: The Case of Och-Ziff
Here’s a quick multi-factor analysis of Och-Ziff Overseas II, more precisely of its last 77 monthly NAVs (including May 2010). There are a few interesting take-aways:
- 99% of OZ’s performance, per the Adjusted R-Squared, can be explained by this factor model, which is obviously almost perfect.
- The factors explaining the performance in this model are the S&P 500, the MSCI World index, the Leveraged Loan index, and the Credit Suisse High Yield Bond index.
- The sign of the terms for the S&P 500 and the Leveraged Loan index is negative (with high t-stats. Actually, the t-stats leave no doubt on the significance of the parameters, since they’re all, in absolute terms, above 6.) That is, a significant part of OZ’s returns comes from being SHORT the S&P500, or rather, more probably, by hedging HY bond and global equity positions with shorts/puts on the S&P500.
- Whatever the best explanation for the negative S&P coefficient, this factor analysis indicates that OZ certainly is not a simple levered play on any of these markets.
SUMMARY OUTPUT
Regression Statistics
Multiple R 0.994780933
R Square 0.989589104
Adjusted R Square 0.989018644
Standard Error 0.019640803
Observations 78
ANOVA
df SS MS F Significance F
Regression 4 2.676752148 0.669188037 1734.721144 1.61407E-71
Residual 73 0.028160565 0.000385761
Total 77 2.704912713
Coefficients Std Error t Stat P-value
Intercept 0.918831919 0.028415423 32.33567607 5.221E-45
MSCI World 0.000880636 9.31751E-05 9.451410452 2.66496E-14
Lev Loan index -0.007563448 0.00059902 -12.6263688 4.89766E-20
CS HY Index 0.001589215 .2593E-05 37.31167533 2.72932E-49
S&P 500 -0.000828656 0.000126406 -6.55550518 6.87152E-09
M&A Feast for Hedge and Private Equity Funds
Here's the ranking of the Top 30 pending M&A deals, ranked by deal size. It will be a hedge and private equity funds feast: not only are they often acquirers (Thomas H. Lee, Apollo, Icahn), but many of the target are among their portfolio companies: Talecris, for example, is owned by Cerberus.
| Target | Acquirer | Deal Size (M) | Announced Premium in % | Payment Type | Current Premium in % | Expected Completion Date | |
| XTO ENERGY INC | EXXON MOBIL CORP | 41366.82 | 25.94 | Stk | 0.05 | 06/28/10 | |
| QWEST COMMUNICATIONS INTL | CENTURYLINK INC | 22161.55 | 12.49 | Stk | 6.84 | 06/30/11 | |
| SMITH INTERNATIONAL INC | SCHLUMBERGER LTD | 12342.48 | 42.18 | Stk | 2.22 | 12/31/10 | |
| ALCON INC | NOVARTIS AG-REG | 10567.14 | -5.99 | Stk | -9.31 | ||
| ALLEGHENY ENERGY INC | FIRSTENERGY CORP | 9216.11 | 36.15 | Stk | 14.17 | 04/30/11 | |
| MILLIPORE CORP | MERCK KGAA | 6805.77 | 42.48 | Cash | 0.38 | 12/31/10 | |
| AIRGAS INC | AIR PRODUCTS & CHEMICALS INC | 6641.21 | 27.13 | Cash | -3.83 | 08/13/10 | |
| SYBASE INC | SAP AG | 5322.65 | 47.75 | Cash | 0.73 | 07/01/10 | |
| TALECRIS BIOTHERAPEUTICS | GRIFOLS SA | 3890.94 | 53.45 | C&S | 22.9 | 12/31/10 | |
| MARINER ENERGY INC | APACHE CORP | 3801.5 | 60.85 | C&S | 4.38 | 09/30/10 | |
| CONTINENTAL AIRLINES-CLASS B | UAL CORP | 3185.64 | 1.61 | Stk | -0.19 | 12/31/10 | |
| PSYCHIATRIC SOLUTIONS INC | UNIVERSAL HEALTH SERVICES-B | 3114.41 | 6.1 | Cash | 3.04 | 12/31/10 | |
| INTERACTIVE DATA CORP | Multiple | 2996.24 | 1.81 | Cash | 1.62 | 09/30/10 | |
| BUCKEYE GP HOLDINGS LP | BUCKEYE PARTNERS LP | 2720.89 | 30.42 | Stk | 6.96 | 12/31/10 | |
| EV3 INC | COVIDIEN PLC | 2489.97 | 19.71 | Cash | 0.67 | 07/31/10 | |
| MIRANT CORP | RRI ENERGY INC | 2273.7 | -1.01 | Stk | 1.52 | 12/31/10 | |
| CASEY'S GENERAL STORES INC | ALIMENTATION COUCHE-TARD -B | 1862.09 | 16.34 | Cash | 1.15 | 07/09/10 | |
| CYBERSOURCE CORP | VISA INC-CLASS A SHARES | 1796.58 | 40.38 | Cash | 2.08 | 12/31/10 | |
| GERDAU AMERISTEEL CORP | GERDAU SA-PREF | 1607.07 | 47.5 | Cash | 0.58 | ||
| ARENA RESOURCES INC | SANDRIDGE ENERGY INC | 1563.56 | 25.82 | C&S | 1.74 | 09/30/10 | |
| DYNCORP INTERNATIONAL INC-A | Private (Cerberus) | 1472.82 | 50.21 | Cash | 0.98 | 12/31/10 | |
| ECLIPSYS CORP | ALLSCRIPTS-MISYS HEALTHCARE | 1242.63 | 20.05 | Stk | 7.33 | 12/31/10 | |
| RCN CORP | Private | 1192.29 | 38.33 | Cash | 1.08 | 12/31/10 | |
| AMERICAN ITALIAN PASTA CO-A | RALCORP HOLDINGS INC | 1171.62 | 36.22 | Cash | 0.36 | 07/22/10 | |
| GLG PARTNERS INC | MAN GROUP PLC | 1130.59 | 42.09 | Cash | 3.69 | 09/30/10 | |
| INVENTIV HEALTH INC | THOMAS H. LEE PARTNERS LP | 1091.03 | 9.85 | Cash | 2.04 | 09/30/10 | |
| STANLEY INC | CGI GROUP INC - CL A | 1054.64 | 20.07 | Cash | 0.54 | 07/09/10 | |
| CKE RESTAURANTS INC | APOLLO GLOBAL MANAGEMENT LLC | 1009.5 | 5.91 | Cash | 0.32 | ||
| LIONS GATE ENTERTAINMENT COR | ICAHN ENTERPRISES LP | 1001.42 | 32.6 | Cash | -0.92 | 06/30/10 |
Tuesday, June 15, 2010
Deep Discounts on Secondary Market for Hedge Fund Investments
HedgeBay tracks the average haircuts applied to investments in hedge funds resold on the secondary markets. It just reported its latest numbers, and the result is ugly. Whereas positions transacted at a roughly 15% discount last year, the haircut is now about 28%, on average:


Benchmarking Volatility Strategies
The Standard & Poor Volatility Arbitrage index is a interesting benchmark for the different vol arb hedge funds out there. The index measures the performance of a variance swap strategy that consists of receiving the implied variance of the S&P 500 and paying the realized variance of the S&P 500. The rationale behind this strategy is that implied vols tend to exceed realized vol, and it’s been almost always the case for the S&P500: 
Despite the sudden spike in realized volatility, the S&P Vol Arb index still outperforms the equity market (S&P500) since inception in 1990. The graph below plots the total return version of the Vol Arb index (SPARBVN, in amber) calculated on a total return (funded) basis, versus the total return on the S&P 500 (with dividend reinvestment) shown in white. Indeed, the Vol Arb index shows that a rule-based variance swap strategy, despite the drop in the Fall of 08, is still far ahead of the return on the S&P500. Moreover, its volatility is clearly much lower. 

Despite the sudden spike in realized volatility, the S&P Vol Arb index still outperforms the equity market (S&P500) since inception in 1990. The graph below plots the total return version of the Vol Arb index (SPARBVN, in amber) calculated on a total return (funded) basis, versus the total return on the S&P 500 (with dividend reinvestment) shown in white. Indeed, the Vol Arb index shows that a rule-based variance swap strategy, despite the drop in the Fall of 08, is still far ahead of the return on the S&P500. Moreover, its volatility is clearly much lower.

Monday, June 14, 2010
Owl Creek Overseas Correlation With Equity Markets
The Owl Creek Overseas hedge fund is often presented as uncorrelated to equity markets -- but this is a myth.
On the surface, it looks true: correlation with the S&P500 index, since inception, is 11%, and the linear regression doesn’t even have good explanatory power (t-stat is weak, only 1):

But it you look closely at the above graph, you’ll notice two areas clustered around two diagonals, one in the top left corner and the other around one of the main diagonals. The graph below makes that more clear:

In fact, correlation with the S&P500 has been atrociously high over two distinct periods: from inception to end of December 2007, when correlation was 97%; and from the end of October 08 to present, when correlation has been 92%. Only 10 months of returns are spread out in a random/uncorrelated fashion between the two periods. This shift in correlation regime, to use technical words, created the “Z-shaped” plot of the first graph, which of course fools linear regression and entails an artificially low correlation for the whole period.
Tuesday, May 4, 2010
Thursday, March 18, 2010
Largest U.S. Hedge Funds, by Assets
BofA/ML published a report today, ranking U.S HFs by AUM as of Jan 1, 2010, in billion dollars. Some of their data are clearly wrong (e.g. Paulson). As shown in the table, some numbers differ significantly from those reported in the March issue of Absolute Return + Alpha, such as Soros, which has $27bn under management according to the magazine.
Name AUM according to BAML AUM according to AR+A
Bridgewater 43.6 43.6
Paulson & Co. 15 (incorrect!) 32 (definitely correct)
King Street 18.5 19
D.E. Shaw & Co. 16.1 23
Och-Ziff 14.4 23
Baupost Not mentioned 21.8
Angelo Gordon Not mentioned 20.8
Farallon Not mentioned 20.7
SAC Capital Advisors 14 12
Highbridge 12.4 17.9
Citadel Investment Group 10.7 12
Renaissance 9.2 15
Tudor 9.2 10
TPG-Axon Capital 8.3 9.6
Soros Fund Management 8.3 27
Viking Global Investors 7.6 11.8
Name AUM according to BAML AUM according to AR+A
Bridgewater 43.6 43.6
Paulson & Co. 15 (incorrect!) 32 (definitely correct)
King Street 18.5 19
D.E. Shaw & Co. 16.1 23
Och-Ziff 14.4 23
Baupost Not mentioned 21.8
Angelo Gordon Not mentioned 20.8
Farallon Not mentioned 20.7
SAC Capital Advisors 14 12
Highbridge 12.4 17.9
Citadel Investment Group 10.7 12
Renaissance 9.2 15
Tudor 9.2 10
TPG-Axon Capital 8.3 9.6
Soros Fund Management 8.3 27
Viking Global Investors 7.6 11.8
Wednesday, March 17, 2010
This graph of front-month futures contracts nicely shows the cyclical behavior of this commodity: because production is constant throughout the year but consumption in North American peaks in winter, and because storage costs are significant for natural gas, the forward curve slops upward when stocks are being accumulated, which is in the fall. Once the colder months are passed, the forward curve slops downward.


Ultra Futures Contract
Forgot to say that the new 30-year "Ultra" futures contract is made possible by the recent surge in issuance of 30-year bonds by the Treasury...
Tuesday, March 2, 2010
A New T-Bond Futures Contract: the Ultra
The T-Bond futures contract we all know has a large range of deliverable securities: all U.S. bonds with remaining terms to maturity of 15 years or more. This made the choice of the CTD (Cheapest To Deliver) quite large and the embedded option quite valuable.
A new contract was launched by the CME Group, the Chicago exchange. The so-called Ultra T-Bond futures takes as deliverable bonds with at least 25 years of remaining term to maturity. This opens the door to quite a few trades and asset-liability management ideas, some of them being detailed on the CME web site: www.cmegroup.com/ultra.
BTW, the code for this new contract is "WN" like "US" is the code for the classic T-Bond futures and "TY" for 10-year contracts. For example, WNH0 refers to the March 2010 Ultra futures contract.
A new contract was launched by the CME Group, the Chicago exchange. The so-called Ultra T-Bond futures takes as deliverable bonds with at least 25 years of remaining term to maturity. This opens the door to quite a few trades and asset-liability management ideas, some of them being detailed on the CME web site: www.cmegroup.com/ultra.
BTW, the code for this new contract is "WN" like "US" is the code for the classic T-Bond futures and "TY" for 10-year contracts. For example, WNH0 refers to the March 2010 Ultra futures contract.
Tuesday, February 23, 2010
China and India Piling Up on Gold -- So What?
China and India piling up on gold? Sure; their reserves increased 76% and 56%, respectively, YoY, as can be seen below. Yet, their reserves are smalls relative to the rest of the world -- Venezuela had as much gold as India until last year!


Railroad Freight

A good macro-economic indicator: railroad freight carloads. Notice how flat the trend was, with very regular but very short end-of-year drops. The drop since end of 08 is a clear indicator of the recession -- perhaps a leading one?
Monday, January 25, 2010
Best Performing Hedge Fund Strategies This Past Decade
Based on the HFR indices, here are the top hedge fund strategies over the past decade. We can note that converts have had bad years but were top performers on exit of recessions (2002, and 2009). Distressed investing shows a similar pattern (#3 in 01 and 03 and #1 in 2004, then #4 in 2009). Emerging markets have been consistently good performers these past few years, except in 08. Systematic strategies have done very well in the second half of the decade, even in 2007 despite August of that year; of course, last year is an exception due mostly to trend followers.
(click on chart to enlarge. Source: dataforthoughts)

(click on chart to enlarge. Source: dataforthoughts)

Palladium and Copper Retraced
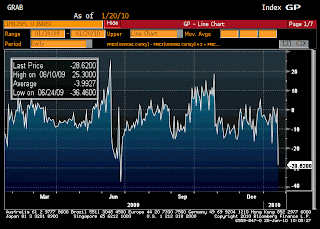
Palladium and copper came back in line with their linear historical relationship. The palladium contract was at $462 on 1/20, as indicated in the white panel, and as of Friday had lost about $20, while the copper futures had barely budged.


Butterfly Retraced Friday
Here's the same butterfly as of early afternoon Friday. The reason the downside peak we had seen on a previous post does not show up is simply that this chart shows only market-close levels.


Thursday, January 21, 2010
Butterfly on 1-Month Options on Mid-Term Swaps
The 50:50 fly on 1-month options on 1-, 2- and 5-year swaps is current 2.7 standard deviations from its 1-year average.

Palladium and Copper
March contracts on palladium and copper at 0.8 std devs from their regression line.


Thursday, January 7, 2010
Follow-Up on RYL v. KBH
Since my post of the pair trade long KBH/short RYL, KBH jumped 14.4% from $13.80 to $15.80 while RYL increased 6.8% from $20.50 to $21.90. With a hedge ratio of 0.88, the gain is $2*0.88 - $1.4 = $0.36 per share shorted.
Subscribe to:
Posts (Atom)

 Posts
Posts

